In Maryland in 2018, 69.6 evictions were filed for every 100 renter households. Right next door in Delaware, the number was only 15.9 evictions. Why?
West Virginia, with a median household income of only $44,000, had only 4.9 evictions for every 100 households. New Jersey, with a household income nearly twice West Virginia’s, (2018: $81,740), had an eviction rate nearly three times higher.
What gives, you might ask? How can a major household crisis like eviction be so different for two neighboring states? Or so much higher in a state whose residents have a higher median income?
Questions like these once lurked in the shadows of national public awareness. That only began to change a few years ago when the Eviction Lab at Princeton University pioneered a nationwide database of evictions to throw a bright light on the social problem of housing insecurity. Over the years, the Lab has searched court filings covering every county in the United State to build a collection of over 100 million court eviction records between 2000 and 2018.
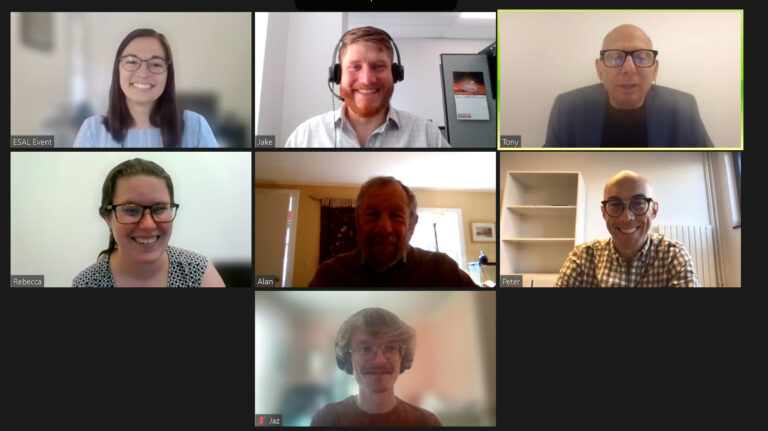
Recently, Engineers and Scientists Acting Locally (ESAL) joined with the Eviction Lab in a panel discussion exploring this gap and helping our audiences understand the power of data, especially in the areas of housing insecurity, equity, and social justice.
Sociologist Peter Hepburn, associate director of the Eviction Lab at Princeton University and assistant professor at Rutgers University, discussed the obstacles faced by the Lab’s founder, Matthew Desmond, when he set out to study the scope of housing insecurity nationwide. “The federal government collects little or no data about eviction,” he said. “And states vary widely in what data they make available, if any. It's very hard to answer those questions without that sort of data being made available.” To remedy this, Desmond and the lab spent years compiling a national eviction database of more than 100 million court eviction records from almost every part of the country. This huge task allowed them to generate interactive maps showing local eviction filing rates, how many households were affected, and how much eviction varies between different states. They found that evictions tended to be concentrated in certain neighborhoods, even certain buildings, with strong racial and gender disparities.
When the pandemic hit, Lab researchers used web scraping tools to find contemporary eviction data from courts in select jurisdictions around the country, letting them compare COVID-driven evictions to historical data about pre-pandemic evictions. Over time, they built a website with pandemic-related eviction data on ten states and 34 cities, a total of almost 3 million cases, which allowed them to track the impact of the COVID-19 pandemic and associated housing policies in real time. Using this resource, they were able to illustrate the impact of the Centers for Disease Control and Prevention agency moratorium on evictions, which successfully drove eviction rates down throughout the country. Since the moratorium has lifted these rates have steadily risen, and in some cities have gone well above historical averages.
Alan Mallach, a senior fellow with the Center for Community Progress, used data to help him write multiple books about urban growth, decline and housing, especially in smaller American cities that struggle with deindustrialization. He sees eviction as a failure within a total housing ecosystem that includes the rental housing stock, tenants, property owners, and the multiple policies that interact with them and can intervene in the system.
Mallach highlighted that there are some amazing data sets that are available to better understand this system, including published data on population demographics and mortgage lending, as well as public records data on real estate transactions, vacant property, and foreclosures. He also noted that rental registration requirements are becoming increasingly common in most states, which enables the creation of databases on landlords and rental properties. This information makes it possible to ask specific and focused questions: who owns particular properties? What are the characteristics and conditions of each unit? What rents are being charged? Most importantly, analyzing this data helps to inform what policies will be most effective at preventing evictions and other housing ecosystem failures. “I want to stress the purpose of gathering all of this data is not so much to create a database for research,” Mallach noted, “but to create the basis for effective interventions in the rental system.”
KC Tenants, a citywide tenant union in Kansas City, faced some of the same data gathering challenges as the Princeton Eviction Lab but on a tighter budget. The third panelist, Jaz Hayes, used his self-taught programming skills to find ways to build up an eviction data set with 1.2 million records. Hayes grew up in poverty himself in Kansas City; his mother faced eviction herself when she was pregnant with him. Working as a volunteer for KC Tenants, he recognized data gaps and acquired the skills to begin filling them, allowing the organization to further galvanize and organize tenants and support their policy demands with local data. “We started by a one-off request from one county spanning about 20 years and it included about 200,000 records,” he said. “Since then, we have expanded that data set to the entire state of Missouri, over the entire period that is digitally available.”
By geocoding addresses in the eviction records, Hayes can map out where evictions are happening and determine which properties have the highest rates of eviction. Today, KC Tenants has a database of 1.2 records going back 30 years.
That data helped point out a decades-old pattern of legally-enforced segregation in Kansas City. KC Tenants’ database shows how the minority population concentrated east of Troost Avenue correlates with concentrations of both poverty and eviction filings. Mapping eviction filings as a percent of renter occupied housing units shows this effect no matter the time period. “If you're from Kansas City, this is completely unsurprising,” Hayes said. “But it's validating to have the data to reinforce that knowledge.”
The data gathered by KC Tenants also found only about three percent of tenants have a lawyer when facing eviction proceedings. “This creates a huge imbalance in the power relationship between a landlord and tenant when they go to court,” Hayes said. KC Tenants used this knowledge to help the city reach out to tenants to explain how the Kansas City government guarantees the right to an attorney in eviction cases. “Our city has a complicated political geography, where our city limits span across four different counties and only one of those counties has agreed to share their court filings with the city government,” Hayes said. “The other three have not.” KC Tenants stepped in to fill that gap, sharing their current eviction data with the city so they could inform tenants of their right to a lawyer. “There are countless ways that we could use this data. We haven't even really scratched the surface on it,” Hayes said.
All three panelists agreed the importance of data for policymaking and pursuing social justice doesn’t mean they’re easy to use. But it is still an exciting time for anyone who wants to use data for advocacy. Anyone who wants to advocate for a cause can start with what’s already there. “How do you understand systems?” Alan Mallach said. “You don't understand them by just looking at them or trying to wing it. You understand it by grabbing all the data you can and analyzing it so you can get a comprehensive picture of the system. You start with the insight from basically kind of a gut understanding what's going on and then you use data to build your real understanding of how the system is working.”
With all that potential, the panelists agreed on the importance of knowing where data came from and how they were created. “These are messy records,” Peter Hepburn said. “Learn how those data were actually collected. Things that look self-evident at face value may be a lot more complicated when you really dig into the creation of that data. It's important to understand where data come from before you start using them. There are a lot of ways to misstep.”
It's also important to understand that social statistics begin their life as events, things someone actually lived through. Jaz Hayes found his own childhood experience with housing insecurity helped him put a human face on the bare bones of the numbers. “A lot of public policy doesn't so much come from data as it comes from lived experience,” he said. “We have a massive base of poor and working class tenants. We know that we know the problems we face and we've got some sense of an idea of how to address them. Where data is useful is convincing the people who are not personally experiencing it. A lot of our members know personally that going through eviction court is really difficult. It's a complicated legal system. You're scared and alone and like it doesn't take data to know that. The place where data comes in is where we can take a step back outside of our own lived experience and look at it systematically and say you're not alone.”
It's become clear that new data on evictions, while not solving all problems, have succeeded in casting eviction in a new light in a relatively short time. Evicted, by the Eviction Lab’s founder Matthew Desmond, became a bestseller and won multiple prizes. All three panelists agreed that data about eviction can play multiple roles in shaping urban policy and achieving social justice. Many aspects of eviction, including the questions about its size, scope, and unequal impact that began this report began to emerge as policy questions only after the data compiled by groups like the Eviction Lab and KC Tenants allowed them to emerge as something that could be measured.
The recording of this event may be accessed on the ESAL YouTube channel.