Delving into the nuances of municipal budgets should not be reserved for experts. With a little determination, paired with guidance, it can be a worthwhile experience that sheds light on local priorities and decision-making. This is the second in a series of three articles to help you understand and interpret local budgets. For additional articles in this series please see:
Thanks to the efforts of a group of passionate volunteers from the Oakland, Calif. brigade of Code for America called Open Oakland, the city has been releasing the yearly data files detailing the city’s budget. Through its Open Budget Oakland project, the brigade has since been elucidating the patterns stored in rows of this budget data through visualizations. We chatted with Open Budget Oakland’s Felicia Betancourt and Jess Sand about the Open Oakland organization and its impact on the community.
MS: How does Open Oakland empower community members to find a voice in legislation that impacts them?
Sand: We have been around since 2012 and we've historically done project-based work such as building tech-based, digital platforms and tools to help connect the community with government, whether that's policy, data, or other forms of access. For example, Councilmatic is one of our projects that makes city council meetings more accessible to people by making the agendas easier to understand.
We’ve also very much been a convener. City Camp was an annual event that happened for many years and brought people together from local government -- city administrators, policy makers, residents, neighbors, advocates and organizations, and nonprofits in Oakland -- and connected people that would otherwise not necessarily have access to each other in a regular setting.
Betancourt: The first step in participating is knowing what the government is doing or not doing, and what the government has committed to do or not do. Is there a discrepancy between what they said and what they are doing? The budget is basically a record of what the city government commits to do. Making budget data more interpretable basically allows anybody in the community to target their demands a little bit more effectively.
MS: Could you give a few examples of how Open Oakland has helped grow a community around its projects?
Sand: On a monthly basis, hundreds of visitors across our sites access this information and use it in different ways. Some examples of that are Open Disclosure Oakland. Open Disclosure is one of our projects around campaign finance. Local media uses it as a key data source to report out to the public what kind of money is coming in and going out of local campaigns.
We also partnered with La Escuelita, which is a K-8 school here in the city that was really struggling without a website. When the pandemic hit, they had no good way to communicate with parents and the administration was struggling. We were able to give them a channel that they can manage and use going forward to communicate with parents and keep folks connected at a time when, obviously, that becomes incredibly critical.
I've been leading and working on the West Oakland Air Quality project, which has been ongoing for a couple of years. And we've been working with the Environmental Indicators Project in West Oakland. They're a nonprofit who has done some incredible work in the neighborhood, around air quality and public health and legislation and community development. We have been able to support their digital capacity and help them tell their story and help amplify their voices that way.
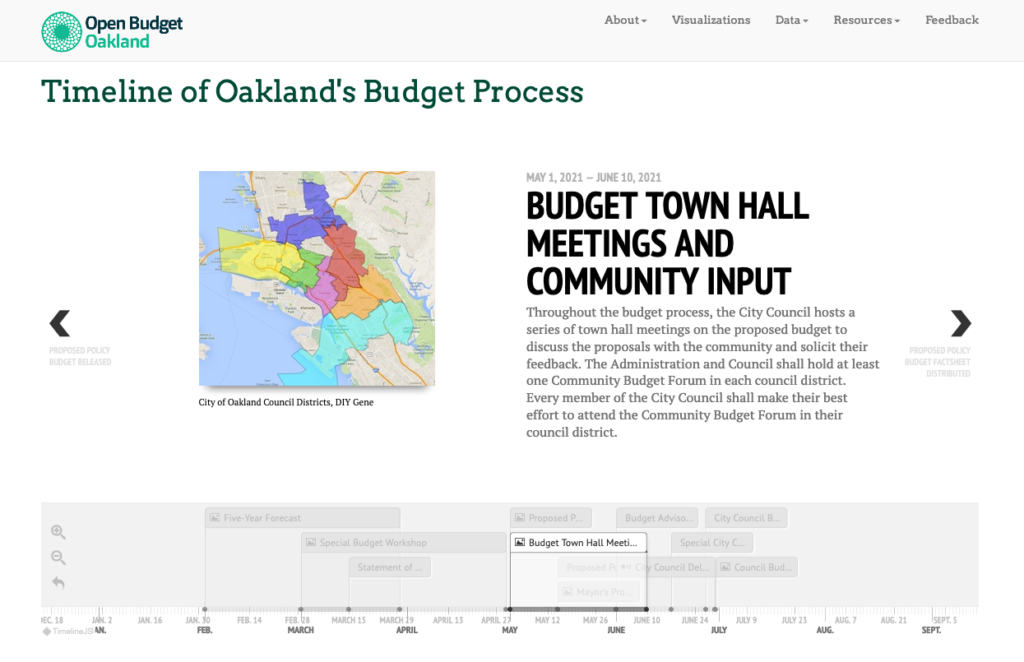
Timeline of Oakland’s Budget Process by Open Budget Oakland
MS: How did you initially know that you wanted to use your coding skills and expertise for public policy efforts?
Betancourt: I'm aware of the need that a lot of government entities, at all different levels, may not have access to the expertise that a well-funded VC-fueled startup might have. I felt that I would be welcome as someone who does not look like most of the tech industry, and I'll be able to make an impact.
Sand: I was really just interested in getting to know the different communities in the city. So I work with the nonprofits normally. Open Oakland was very accessible and it was easy to roll up my sleeves and just start working and doing stuff that felt productive and helpful.
MS: Why is it important for Oakland community members to know about the budget?
Betancourt: When you think about data, almost the first thing you think of is budget data, and every city has that. I think that every city’s citizens deserve to see their budgets. The city is spending your money and it's doing things with that money to your community.
So, the budget tells you what the city's priorities are, and those priorities are set by people that you voted for. In order to act, you need to know, well, what are they up to? What are their priorities? Do those priorities align with the needs of my community, or perhaps just my own personal needs? The budget is the source of enormous amounts of information. As the old saying goes, “You know what somebody is about when you follow the money,” and you don't have to take their word for it.
MS: What are the most difficult things to communicate about from the thousands of rows of the budget that are being processed? When constructing visualizations, do you ever tell yourself, “This might be difficult to communicate?”
Betancourt: Number one, it's the nature of data to contain insights that are not apparent. You can always miss hidden patterns that you just didn't think to look at. So there's always this problem of, “We don't know what we don't know.” It's kind of like if you have a bunch of street addresses before you put them on a map, you may not see the blazingly obvious trail that leads from one street and then another street and another street.
It's hard to expose information about an issue that isn't covered by the city's own designated departments and categories. The city controls the data structure. For example, there isn't really an environmental category. So that is definitely the most difficult thing to communicate -- all the hidden gems that I know are there that are not uncovered when we use their data structure.
Felicia Betancourt.
MS: What makes a budget accessible?
Betancourt: An accessible budget answers the real, organic questions that people actually have rather than forcing users to ask certain kinds of questions in a certain kind of way, like “Oh, what is the police department getting?” There're so many questions that people want to ask that they can't ask right now.
Sand: I feel like this idea that the language we use to describe these things, what we spend our money on, what our priorities are, how we categorize these things, how we group them, how we measure them, and how we report on them defines how we understand them. It also reflects what we think about those things, and it can direct or misdirect our attention in different ways. When you talk about how there's no environmental category, then stuff gets buried and lost because it's not surfaced. So how do we surface that stuff in a way that's meaningful for people?
MS: Why is it important that Open Budget Oakland heavily focuses on visualizations?
Betancourt: The alternative is a 20,000 row spreadsheet. That's how the city sunlights the data -- downloadable as a CSV. Not everybody has the software to even handle a CSV of that size. It's tens of thousands of lines. It's not meant to be human readable. Visualizations have a way of presenting a lot of information in a way that's consumable by a person. It's a shortcut to making salient points and to answering very basic questions like, “How much is being spent on the fire department?”
MS: What tools has Open Budget Oakland provided to engage the public with the local decisions inherent in the city budget?
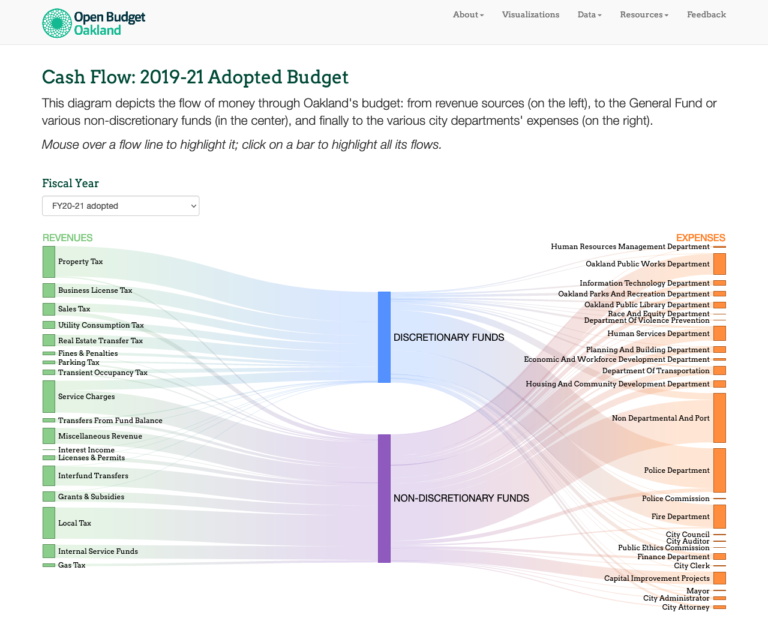
Betancourt: We have four types of tools that people can use. One is an overview tool that shows you the latest budget and it shows you sources of revenue. You can just take it in at a glance and get an idea. You can also click on each revenue source or department and see the actual number instead of only having it visualized for you in terms of whether the threads feeding into it are large or small.
Then there's a comparison tool. You can check out two different budgets, head to head, and see the breakdown by department or by category. You can see it either in terms of percent or dollars. The third one is a drill down tool. It's another way of understanding revenue and income and outflow of money. You don't see everything all at once. You can pick an area that you're interested in and zoom into that to see what's going on inside of that category. It has more information, but you have to interact with it more. The fourth one is a very simple timeline -- what is the next thing that's happening in our budget?
MS: What kind of advice would you give community members who want to start a similar initiative of their own?
Betancourt: It's a big issue, because you get a lot of well-meaning volunteers and they're often coders and they've got itchy finger syndrome. They just want to sit down and start coding and we basically have to tell people, “Hold on. We need to know what to build and how to build it before we do any of that stuff.” I would say, start out by listening, listen, listen, listen. Create opportunities to listen. Then you won't have a situation where you spend a bunch of time where you build something and people ask, “How do I even use this?” When you're designing, be open-minded. Don't say, “This is what we want to design.” Hold off and start out by listening to the community or at least do the best job you can to meet the largest group of people's needs. If you're doing it as a community leader, I assume you know who your community is, but don't just go by your assumptions. Listen. Coding is one of the last steps. I think that's a really important thing to keep in mind.
Sand: It all starts with the relationships that you build. If we're doing this for each other, if we're doing this for our community, it has to be about the relationships. It has to be about the people. I would say my advice is a little bit different in the sense of, “Don't be afraid.” This stuff is doable by anybody with the right tools, the right understanding, the right context, the right resources. Sometimes you have to work for those or dig them up, or, you know, fight for them a little bit.