Our “Local STEM” series highlights local government and community initiatives and organizations in areas related to STEM.
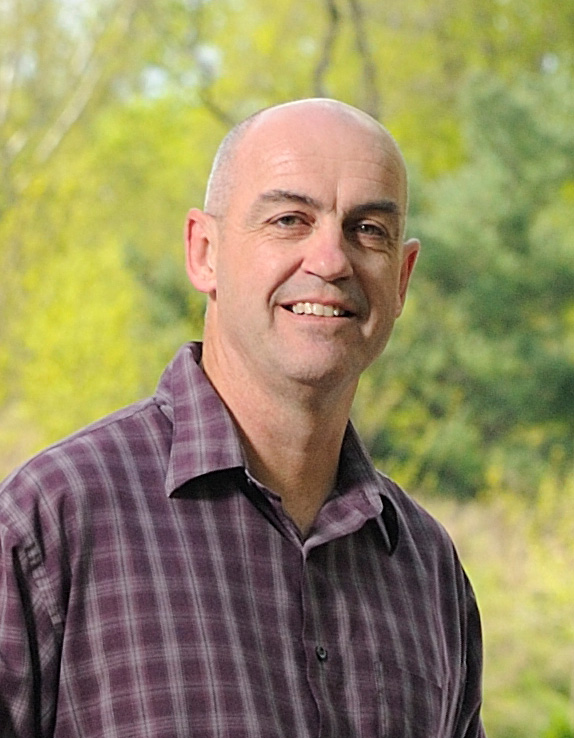
Darryn Waugh is an atmospheric and ocean sciences researcher at Johns Hopkins University’s Earth and Planetary Sciences Department in Baltimore, MD. Waugh is also part of the Baltimore Community Weather Network project (BCWN), a network of community-managed weather stations making atmospheric data more accessible to underserved communities. Waugh holds a Ph.D. in applied mathematics and has decades of experience in climate science-related research.
This interview has been edited for clarity and length.
EB: Can you tell us a bit about how the Baltimore Community Weather Network came to be?
DW: Initially, there was a group of universities, city agencies, and community groups that were awarded a five-year Department of Energy research grant to research the impacts of urban environments, like urban heat islands, flooding, and poor air quality, on the city’s residents. A key focus of it was to do this together with the community groups, the people who are impacted the most, to figure out what they were impacted by and what they would like to see done.
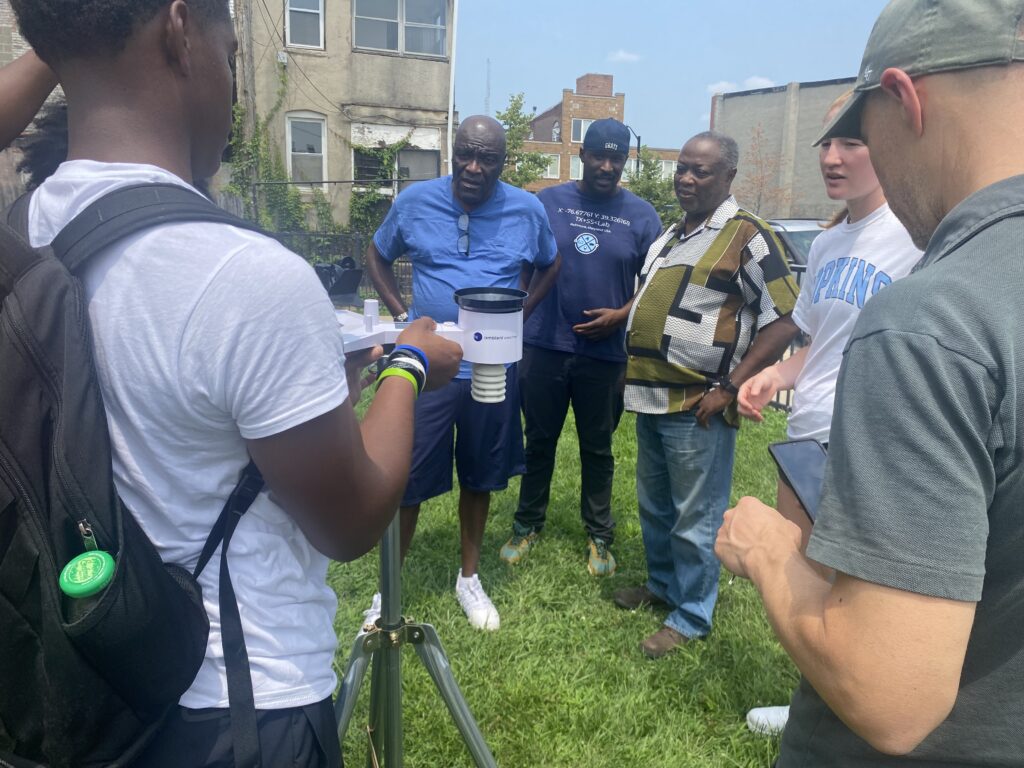
Typically, there’s only one weather measuring instrument in U.S. cities, often away from where people live. We prioritized setting up instruments in areas with underserved populations, which involved working with community groups to find potential co-hosts. We initially planned for ten research-grade stations throughout the city, but after we found out that lower-cost weather stations worked just as well we transitioned to using those. There were already many of that kind of station around Baltimore, but only in high-income areas, so we prioritized setting them up in underserved communities. Because of the lower cost, we were able to add up to 20 in one year, and we’re now up to 60.
EB: Can you elaborate on your process of finding and working with the people and organizations you partner with?
DW: When we wrote the proposal, we already had established relationships with two or three community groups. From there, it was a matter of who we knew, and could help us with introductions. For example, one of our partners was the Baltimore City Government Office of Sustainability, which introduced us to their network of community resilience hubs. Those connections allowed us to get to know more community groups, which included things like churches, schools, and urban farms. Eventually, word of mouth began to bring in more people. We’re now transitioning to trying to stabilize the number of them and make sure we’re covering all the geographic areas.
EB: What impacts have you seen on community engagement and education since you began this project?
DW: The feedback I’ve gotten from multiple partners is that the instrument’s presence offers opportunities for engagement about a range of issues. People see the instrument and get curious, and that allows our partners to engage in a discussion about environmental justice and the necessity of collecting data and documenting the ways weather varies from place to place within the city. Plus, some of our partners now run training programs where they teach community members to collect data, or summer programs where the weather stations can be used in educational activities, or programs to help community organizations write grant proposals. Every partner has different priorities, but in general, it’s the opportunities to start conversations that have the biggest impact. This is part of why we try to put our weather stations where people can see them and get curious about them.
EB: What about the data you’ve gathered? What discoveries have you made?
DW: The other part of putting weather stations where the people are is that it allows us to measure the temperatures they’re actually experiencing. What we’ve found from our stations around the city, which we didn’t know before, is just how much the temperature varies across the city. There’s a nine-to-ten-degree difference in surface temperatures in different parts of the city. We also found that the pattern of this temperature difference changes between day and night. The hottest part of the city at night is around and east of the Inner Harbor, where there are fewer trees compared to the more affluent neighborhoods in the northwest; during the day, the pattern is less clear and varies between days, with days where the hottest part of the city is at its western edge. This could have important implications for city planning and the health outcomes of residents, but more research is needed to draw conclusions. Still, these directions for research would not have come to our attention before.
EB: What advice do you have for someone looking to start a similar project in their own community?
DW: The most important thing is to build relationships and make sure that both sides are getting something out of it. You have to commit time to being out in the community, and make sure you’re doing it because it’s genuinely important to you, not just because you think you have to. We interact a lot with a wide variety of groups, like educational programs, researchers, government agencies, and community groups such as schools, faith-based organizations, and that’s brought different community groups together that may not have come together otherwise. You could focus on one type of organization, such as schools, but then you’d miss the aforementioned opportunities.
EB: What’s next for the BCWN project?
There’s a lot of examples of research groups that put out networks of sensors similar to ours, and got a few good years of data, and then the network had to be pulled down when the research grant ended. Since our federal funding was recently cut short, this is an especially important concern. Accordingly, one of our goals is to keep our network going with a sustainable model for funding, and we’re in discussions with the university and some community groups about that. Also, now that we’ve got three years of data, the other focus is to start analyzing that data in collaboration with our school of public health, and the Department of Health, and see the impacts of heat on health outcomes such as birth weights and asthma. We’re also trying to analyze how the temperature variations are impacted by trees, buildings, and services to make predictions for future urban planning decisions, and to collaborate with city planners to act on this information.
EB: How can interested readers reach out and support the BCWN?
DW: The easiest way to get involved is to reach out to me or on the website. If you’re in the Baltimore area, you could host a new weather station or help collect data, and especially if you’re involved with community organizations that might have some use for a station. Even if you’re not in Baltimore, you can reach out to your local community to gauge interest and need, and if those are there, start your own community weather network.
Are you involved with an organization or effort that you think might be of interest to the ESAL community? Or have heard about an organization or initiative that you’d like to learn more about? Let us know here, and we may feature it in a future post.